.png)
Early-detection breast cancer screenings [such as MRI, ultrasound, and mammography] present results to patients using unfamiliar clinical language and abstract data formats. These result reports are typically full of medical terms, without visuals to support the information, or an option to compare to previous tests. This lack of clarity increases confusion, anxiety, and enlarges the communication gap between patients and medical staff.
Despite widespread awareness campaigns, the absence of accessible, understandable results undermines early detection efforts. Patients are left without a clear understanding of their own health status, and doctors lack standardized tools for effective communication.
The current system for delivering test results - sending patients a text-based document filled with clinical jargon - fails to meet a fundamental need: patient understanding. It lacks tools for comparing current results to previous ones, and offers no easy access to the actual screening images. When available, these images come without visual guidance or explanation. As a result, the process lacks a clear channel for communication between medical professionals and patients - the very individuals these results concern most.
In order to bridge this communication gap, I offered to create an interface - FriendlyScan - that will allow patients, and caregivers [whether doctors, staff, or family members and friends] to better understand the results.

The multidisciplinary research included:
>> Background research on representations of the body in science and culture, with a focus on the female body
>> A short study of radiology terms and imaging methods
>> Interviews with breast cancer survivors to gain insight into the patient experience
>> Interviews with breast surgeons to understand clinical workflows and communication gaps
>> Content and design analysis of 20 real screening result documents from a single patient, focusing on visual design, language, and structure
>> Application of the UNR model I developed to define users, needs, and system requirements.
>> Experimental cyanotype printing of screening images, exploring visual interpretations of medical data
The UNR model I developed stands for Users – Needs – Requirements.
It is a practical design thinking framework used to translate users' needs into concrete system requirements. By tracing each requirement back to a specific user need, it ensures the solution remains focused and functional.
Let's review how it worked in this project:
Stakeholders
The first step in applying the UNR model was identifying all potential stakeholders - anyone who might have an interest in this project. It revealed the true scale of the problem and how many interconnected groups it impacts. By improving communication between patients and doctors, the benefits extend across all stakeholder groups.
I mapped 15 stakeholders, each tagged with an "S" and a corresponding number for reference throughout the process.
%20-%20Copy.png)
Needs
In this stage, I mapped specific needs that emerged from my background research on the communication of screening test results.
By tagging each need to its relevant user, I was able to prioritize the most critical ones and better understand where design interventions would have the greatest impact.
This process led to an important insight: the system should not only serve patients after the test, but also support the medical team during the examination itself.
Currently, test results lack a standardized structure and terms, further complicating interpretation and communication.
.png)
Requirements
Requirements refer to the concrete features or functions the system must include in order to meet users’ needs.
Turning those needs into specific system goals was a crucial step - it allowed me to map out the necessary capabilities and shape the user journey through the experience.
%20-%20Copy.png)
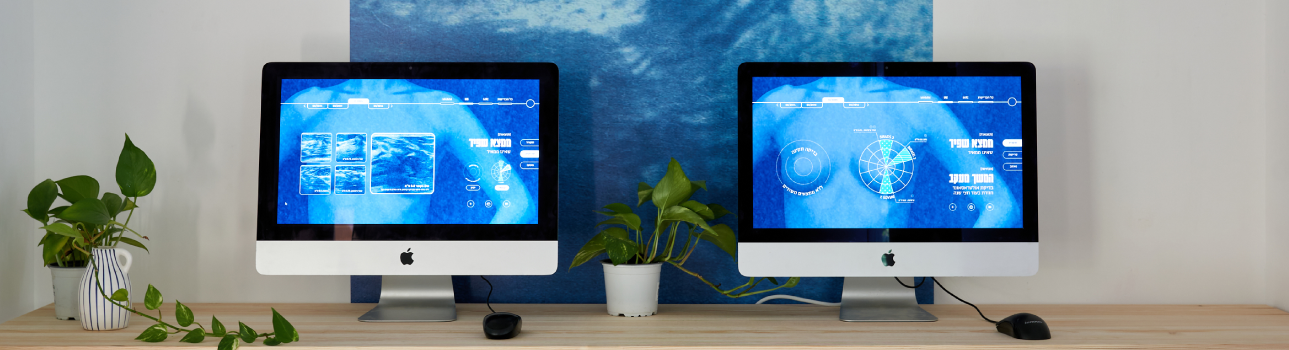
The proposed interface has 3 main screens: Results, Screenings, and Monitoring. This was decided based on how much the patient wishes to dive into the data. All pateinrs will see theresults screen, as it is the main screen, while for both other pages - images and history - they need to nevigate by clicking to move to these pages, and so we allow them a freedom of choice, that fits their intrest and need.
The linear top bar allows users to filter tests according to type [MRI, US, Mammography], and according to date.
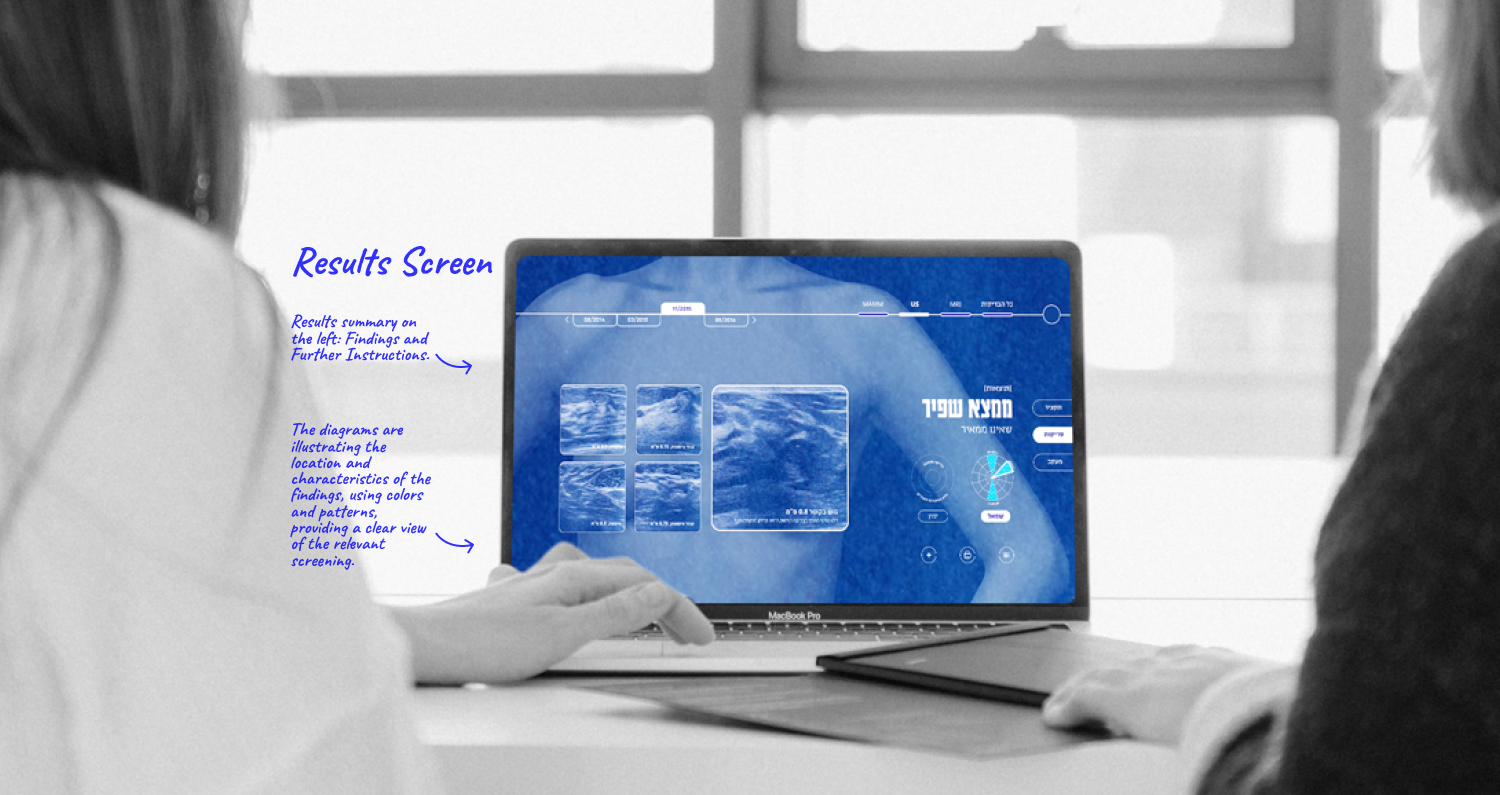
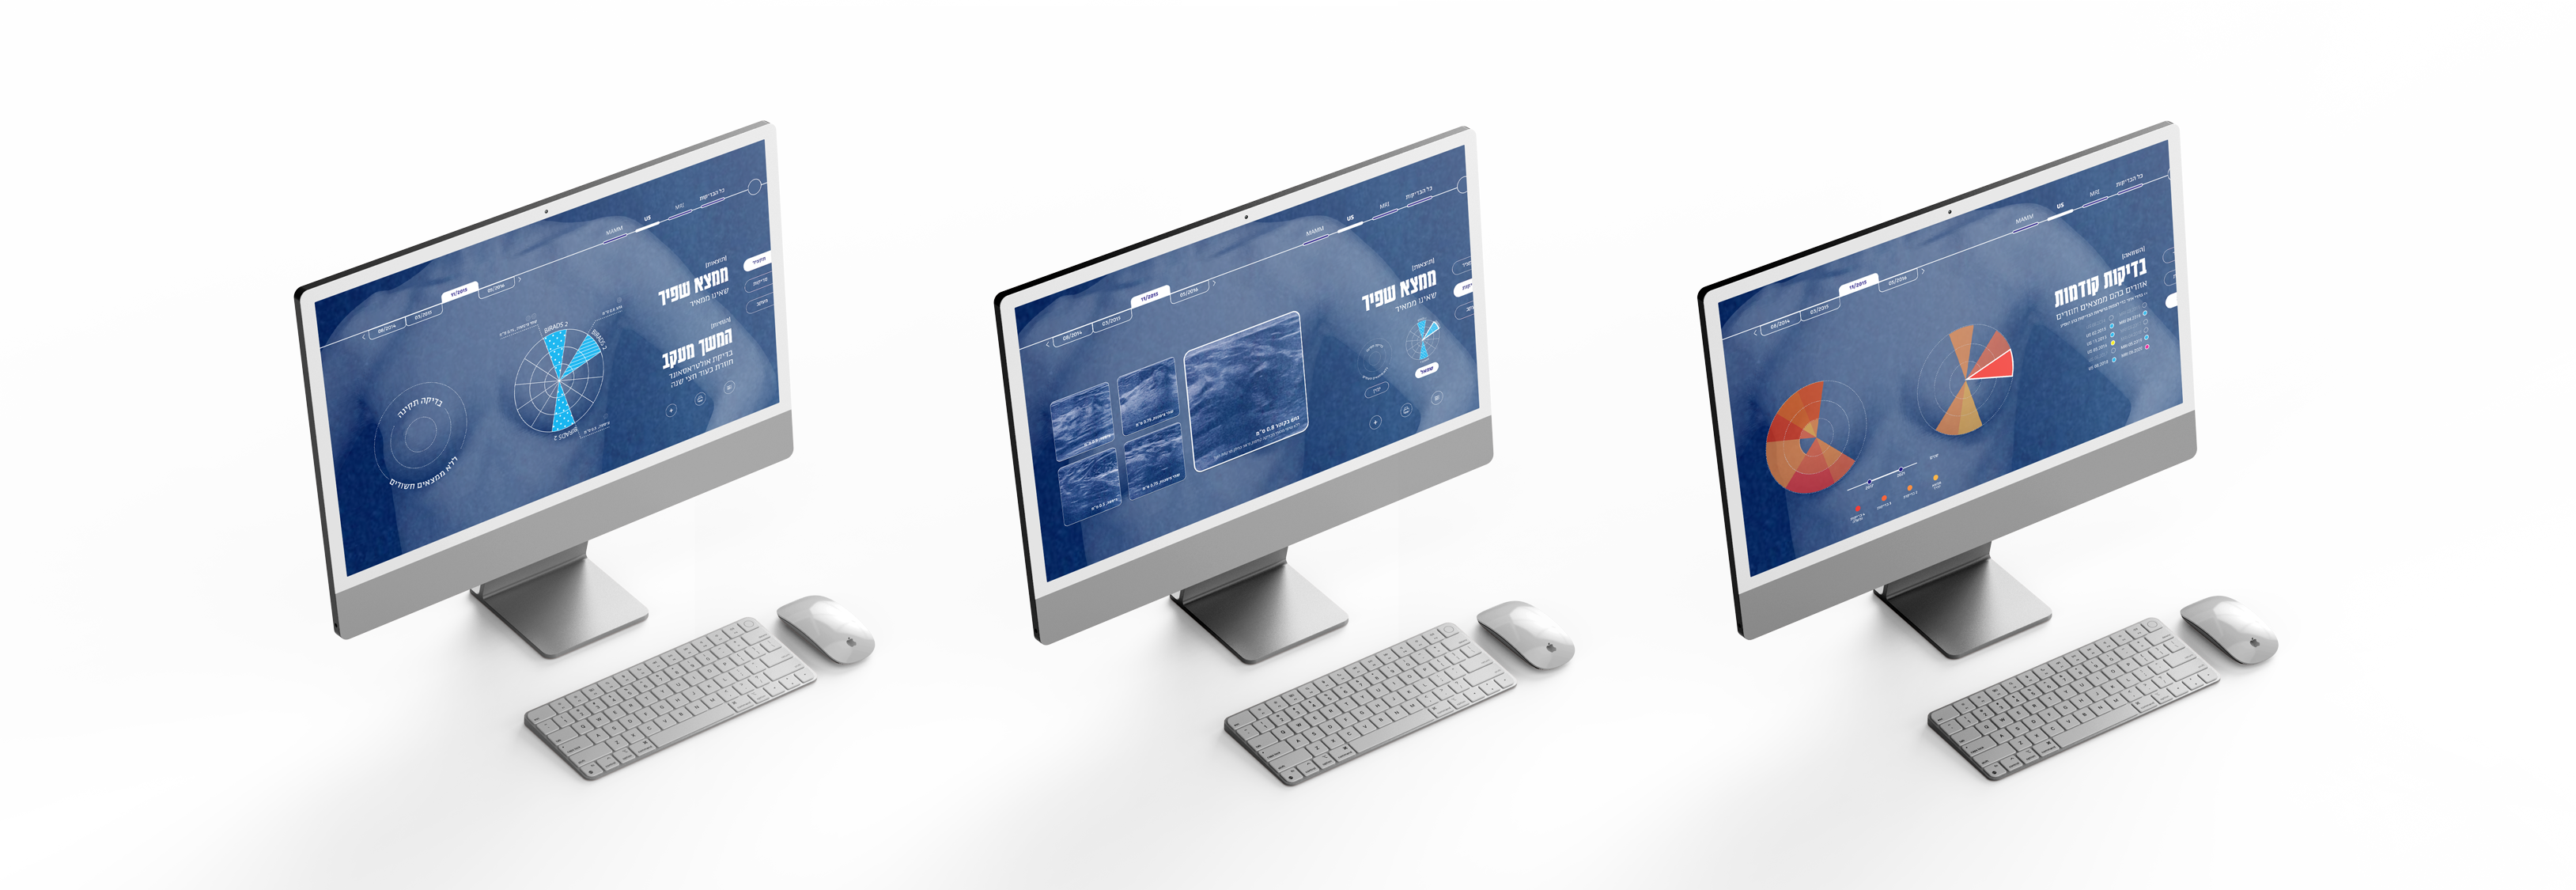
Results Page
A clear and concise summary of findings and next steps.
Findings are visualized through color-coded and patterned diagrams indicating both location and type. A top filter bar allows users to browse results by date or finding type, offering flexibility in how they access and interpret their information.
Screenings Page
Displays medical imaging with annotated findings, offering visual context alongside brief, readable explanations. This screen enhances clarity for patients who prefer to see rather than read, helping them connect emotionally and cognitively to the information.
Monitoring Page
Enables patients to track changes over time by comparing past and current test results. Areas with recurring findings are marked in a darker orange for visibility. Patients can adjust the timeline to review previous years, gaining a clearer sense of their medical journey and trends in their condition.
.svg)